![]()
Quarterly Market Review (2020Q3): Value Vs. Growth
Submitted by Grunden Financial Advisory, Inc on October 9th, 2020When It’s Value vs. Growth, History Is on Value’s Side
Logic and data provide the basis for a positive expected value premium, offering a guide for investors targeting higher potential returns. There is pervasive historical evidence of value stocks outperforming growth stocks. Data covering nearly a century in the US, and nearly five decades of market data outside the US, support the notion that value stocks— those with lower relative prices—have higher expected returns.
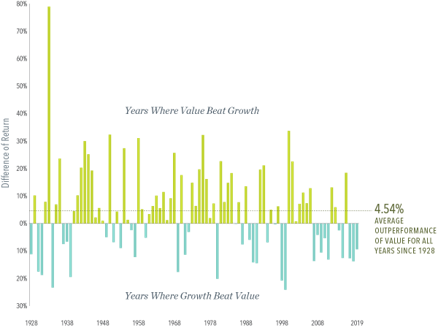
Recently, growth stocks have enjoyed a run of outperformance vs. their value counterparts. But while disappointing periods emerge from time to time, the principle that lower relative prices lead to higher expected returns remains the same. On average, value stocks have outperformed growth stocks by 4.54% annually in the US since 1928, as Exhibit 1 shows.
Some historical context is helpful in providing perspective for growth stocks’ recent outperformance. As Exhibit 1 demonstrates, realized premiums are highly volatile. While periods of underperformance are disappointing, they are also within the range of possible outcomes.
We believe investors are best served by making decisions based on sound economic principles supported by a preponderance of evidence. Value investing is based on the premise that paying less for a set of future cash flows is associated with a higher expected return. That’s one of the most fundamental tenets of investing. Combined with the long series of empirical data on the value premium, our research shows that value investing continues to be a reliable way for investors to increase expected returns going forward.
Exhibit 1. Value Add
Yearly observations of premiums: value minus growth in US markets, 1928-2019
Past performance, including hypothetical performance, is not a guarantee of future results. Investing risks include loss of principal and fluctuating value. There is no guarantee an investment strategy will be successful. Indices are not available for direct investment. Their performance does not reflect the expenses associated with the management of an actual portfolio.
In US dollars. Yearly premiums are calculated as the difference in one-year returns between the two indices described. Value minus growth: Fama/French US Value Research Index minus the Fama/French US Growth Research Index.
Fama/French US Value Research Index: Provided by Fama/French from CRSP securities data. Includes the lower 30% in price-to-book of NYSE securities (plus NYSE Amex equivalents since July 1962 and Nasdaq equivalents since 1973).
Fama/French US Growth Research Index: Provided by Fama/French from CRSP securities data. Includes the higher 30% in price-to-book of NYSE securities (plus NYSE Amex equivalents since July 1962 and Nasdaq equivalents since 1973).
GLOSSARY
Value Stock: A stock trading at a low price relative to a measure of fundamental value such as book equity.
Growth Stock: A stock trading at a high price relative to a measure of fundamental value such as book equity.
Value Premium: The return difference between stocks with low relative prices (value) and stocks with high relative prices (growth).